
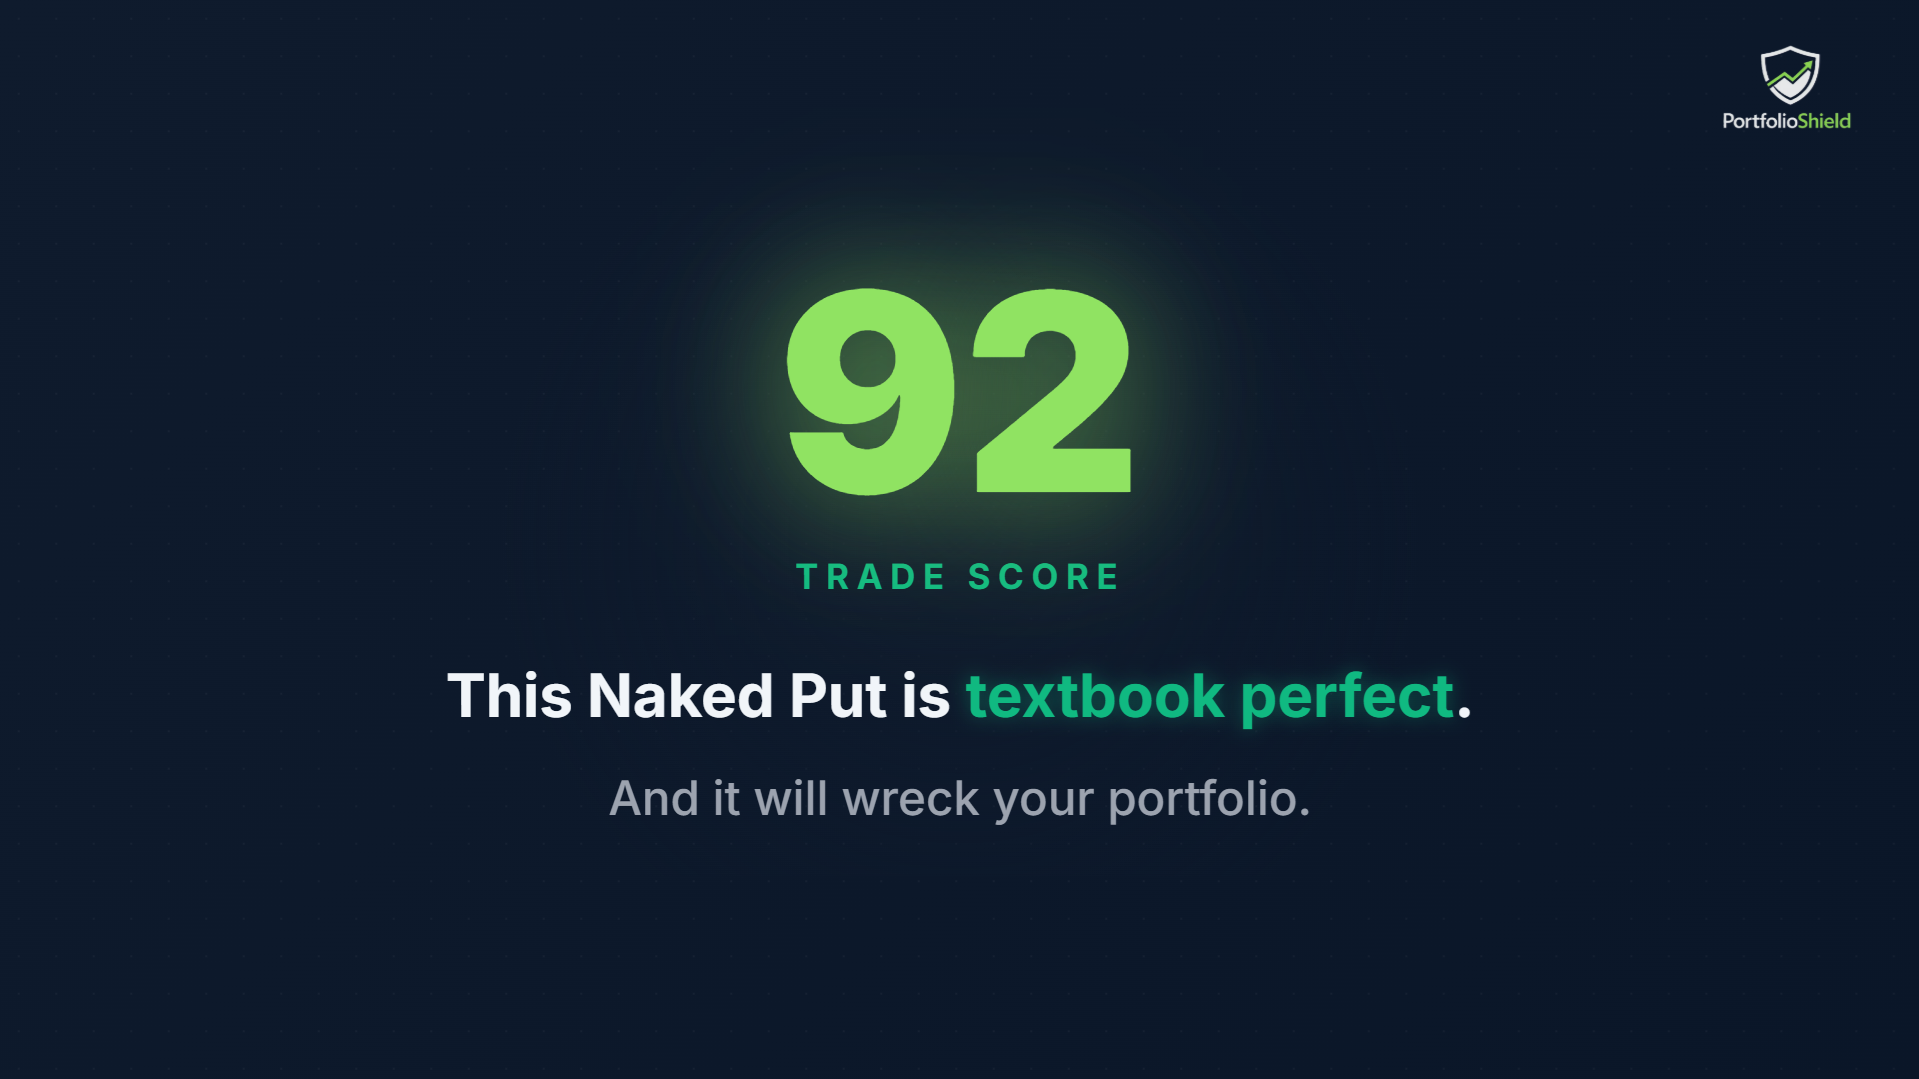
You found it. The perfect trade.
NVDA iron condor, 30 DTE, IV rank at the 82nd percentile, liquidity deep enough to swim in. Your scanner lights up: Trade Score 92. Premium looks fat, probability of profit is high, and the risk-reward ratio checks every box.
You’re about to click “Send Order.”
Don’t.
What the scanner shows you
Every screening tool — Tastytrade, OptionNet Explorer, the screeners built into your broker — evaluates trades the same way. They look at the trade in isolation: implied volatility, delta, theta, probability of profit, bid-ask spread, volume.
By those metrics, this NVDA iron condor is objectively excellent. 92 out of 100. Hard to argue with.

What looks clear in isolation becomes distorted through the lens of your portfolio.
But here’s what none of those metrics measure: what this trade does to the portfolio you already have.
The blind spot nobody talks about
Let’s look at what’s already in the account:
| Position | Strategy | Sector | Status |
|---|---|---|---|
| AAPL | Short Put | Tech | Active |
| META | Short Put | Tech | Active |
| MSFT | Short Strangle | Tech | Active |
| + NVDA | Iron Condor | Tech | Pending |
Three active positions. All tech. All short premium. All correlated.
Adding NVDA pushes sector concentration to 68% — well above the 40% threshold where a single sector event can cascade through your entire portfolio.

Eight tickers on paper. One bet in practice. Correlation is the risk your scanner can’t see.
Trade score 92. Fit score 31.
This is where portfolio-first analysis changes everything.
The Trade Score asks: is this a good trade? Yes. 92. Excellent.
The Fit Score asks: does your portfolio need this trade? No. 31. Dangerous.
That 61-point gap is the most important number in your trading — and no platform shows it to you.
The Fit Score penalizes this trade for three reasons:
- Sector concentration would hit 68% (threshold: 40%)
- Correlation overlap with existing positions is 0.82 average
- Delta stacking — adding more short delta in the same direction your portfolio is already leaning
What should you do instead?
The system doesn’t just flag the problem. It shows you the alternative.
Instead of stacking another tech position, a /GC strangle (gold futures) delivers comparable theta with zero correlation to your existing book. Same income, completely different risk profile.
Or a TLT put spread — negatively correlated to your tech exposure, providing natural diversification while generating premium.
The point isn’t that NVDA is a bad trade. It’s that NVDA is the wrong trade for this portfolio, right now.

What this means for your portfolio
Every premium seller has done some version of this. Found a great-looking trade, added it without checking portfolio impact, and wondered six weeks later why a 3% market dip turned into a 15% account drawdown.
The problem isn’t your trade selection. It’s that no tool in the retail options space evaluates trades in the context of what you already own.
This is the first episode of the Hidden Risks series — exploring the structural failures that quietly destroy income portfolios, even when every individual trade looks good.
PortfolioShield is an analytical tool, not a financial advisor. All content is for educational purposes only. Options trading involves substantial risk of loss.